
Movement Diagrams

Image courtesy of Google Images
Movement diagrams are a tool used to aid teaching and communication, i.e. an objective means of quantifying the relationship between movement and pain determined during a passive examination technique.
During my Masters degree I was continually asked to explain where the onset of pain was, the onset of resistance, the relationship between the two, and the limiting factor to movement. Compiling this information in the form of a movement diagram enabled me to understand the primary cause of the movement abnormality and allow me to carefully select and apply treatment techniques to the problem.
Movement diagrams are a concept that have been taught and will continue to be taught at both an undergraduate and postgraduate level. My personal experience during undergrad was that I paid no attention to the concept, however following my Masters I use them with every patient.
Below is a summary and guideline to Maitland's teachings on the use of movement diagrams. The aim is to expand on your current understanding of the use of this tool, and perhaps encourage you to apply it more frequently to clinical practice.
Why do we use movement diagrams?
The most important reason is to know what we are feeling. Movement diagrams are essential to separate the different components of what is felt when examining movement and to allow you to analyse the effect that treatment is having on signs and symptoms.
"Movement diagrams are essential for to understand the relationship that the various grades of movement have to the patient's abnormal joint signs" (Maitland., 2005. p. 446).
How to construct a movement diagram?
The components considered in a movement diagram pain, spasm-free resistance (stiffness), muscle spasm (where spasm is referring to protective muscle spasm secondary to joint disorder, not spasticity caused by upper neurone disease and not voluntary contraction of muscles).
- Start off by drawing a box.
- Mark the horizontal line AB = which represents the range of movement, where A to B is the limit of normal passive movement. (ROM is determined to be normal if an overpressure can be applied at the end of range without pain, and is denoted by a double tick in clinical notes)
- Mark the vertical line AC = which represents the quality, nature, or intensity of the variables being plotted.
- Mark P1 = the first point of pain along the AB Line
- Mark R1 = the first point of resistance along the AB line.
- Determine the limiting factor (Pain or resistance) and at which point through range the limit occurs. At this point draw a vertical line and label L with a description of the limiting factor i.e. determine what L represents.
- Determine the behaviour of P1P2 and R1R2 and plot them in the box to create linear lines or curved lines.

To determine pain:
- Ask the patient to report when the first discomfort begins.
- If pain is the limiting factor then L = P2
- You should try to describe P2 e.g. P2 (left sided supra scapular pain)
- The line that connects P1 to P2 can either be linear or curvilinear to represent that rate of change in pain.
To determine Resistance:
- Resistance may be due to adaptive shortening of muscles or capsules, scar tissue, arthritic joint changes and more…..
- A normal joint that is relaxed is friction free.
- If pain is the limiting factor then R` is the notation used to represent at what point in resistance the limit has been reached.
- If L = R2 then R1R2 behaviour needs to be defined and expressed on the movement diagram.
Using a movement diagram to determine choice of treatment.
Before you can use the movement diagram to determine what grade of treatment, first lets refresh how Maitland defines these grades.
- Grade 1 = a small amplitude movement near the starting point of R1 but not into resistance
- Grade 2 = a large amplitude movement near the starting point of resistance which is free of stiffness or spasm
- Grade 3 = a large amplitude movement that moves into stiffness or spasm
- Grade 4 = a small amplitude movement that moves into stiffness or spasm.
- These four grades can then be modified as Gr III- -, Gr III -, Gr III, GR III +, and GR III++.
- This has been presented in the diagram below for further clarification.

So to come back to the previous point using a movement diagram to determine choice of treatment, these are the steps you can use to determine the grade of treatment.
- Perform the PAIVM (Passive accessory intervertebral movement) or PPIVM (Passive physiological intervertebral movement), applying overpressure at the end of range as appropriate.
- Decide where P1 and R1 are, what the limiting factor is, and where in range the limit exists.
- Aim not to mobilise with more than 20-25% of pain as a rough guideline. This obviously depends on severity and irritability but is a safe place to start.
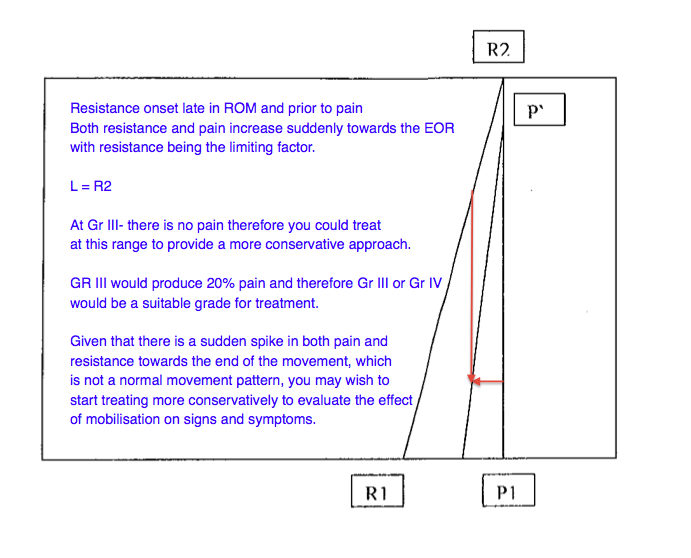
The below images are examples given to me during my masters course when studying the concept of movement diagrams. The comments on the images are my individual thoughts.

Closing thoughts about movement diagrams
Movement diagrams are useful to:

Image courtesy of Google Images
- Explain to patients and therapists what you are feeling during your assessment.
- Help to justify treatment techniques.
- Monitor patient progress.
- And, if used well, patients will really understand the benefit the treatment has on their movement dysfunction, helping to build rapport and trust with them.
Sian :)
References:
Maitland, G. D., & Hengeveld, E. (2005). Maitland's vertebral manipulation. Edinburg: Elsevier Butterworth-Heinemann.